
Written by Sunny Yoon

Written by Sunny Yoon
Consider the following diagram that shows the predator-prey relationship in a willow forest ecosystem.
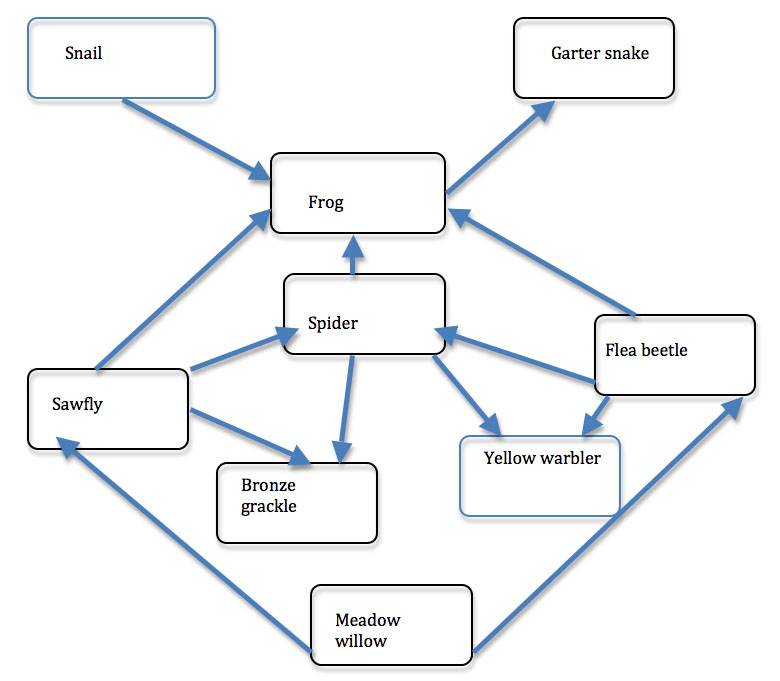
An arrow goes from one species to another if one is food for the other. So, for example, the arrow from flea beetle to spider means that flea beetles are food for spiders.
The diagram can be rewritten where the vertices represent the species and the edges are the arrows. Such diagram is called a directed graph, or digraph.
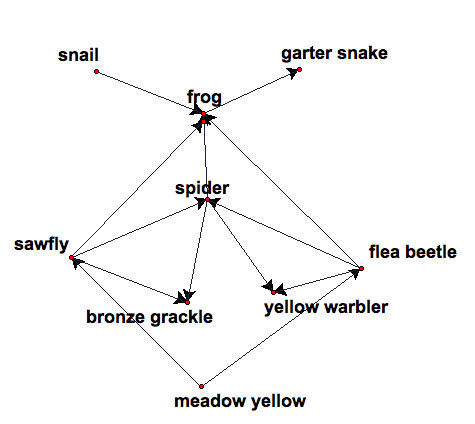
An adjacency matrix for a digraph is a matrix where each entry of the matrix tells how many single directed edges there are from the vertex corresponding to the row to the vertex corresponding to the column. An entry is "1" when there is a directed edge from one vertex to another. An entry is "0" when there is no directed edge from one vertex to another.
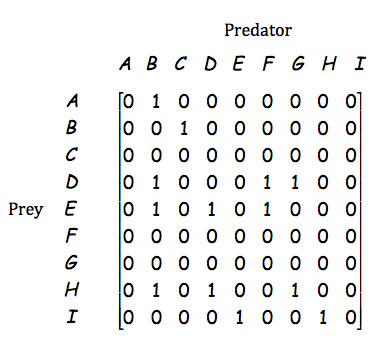
| Snail | Frog | Garter snake | Spider | Sawfly | Bronze Grackle | Yellow Warbler | Flea Beetle | Meadow Willow |
| A | B | C | D | E | F | G | H | I |
An adjacency matrix is constructed using the diagram. "1" means there is a directed edge from one vertex to another. In this matrix, I'm going to look at first row-second column. Row represents prey and Column represents predator. From "A" to "B", there is an directed edge which means that a snail is eaten by a frog. I'll denote this matrix as matrix F.
If you can "walk" from one entry to another entry by following the directed edges, then there is a path between two entries. If you walk on 1 edge, then the path has length 1. So, all the paths in the above matrix are length 1. If you walk on 2 edges to get from one entry to another entry, then there is a path between two entries of length 2.
Let's construct a matrix that shows the number of paths of length two using the diagram.
If you start from snail, there is a path of length 2 to garter snake.
If you start from meadow willow, there exists two paths of length 2 to frog. (meadow willow - flea beetle - frog; meadow willow - sawfly - frog)
If you start from meadow willow, there exists no path of length 2 to garter snake, However, there exists two paths of length 3 from meadow willow to garter snake.
With this logic in mind, let's construct an adjacency matrix that each edge represents a path of length 2. Each entry in the matrix denotes the number of paths of length 2 you can make from one entry to another.
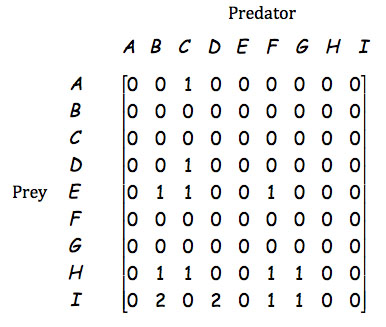
Now multiply F x F. What is the result? It should be the same as the matrix above. For matrices, we denote by A^k the matrix obtained by multiplying A with itself k times.
Let's try to think about an adjacency matrix where each edge represents a path of length 3. So for each entry in the matrix, it denotes the number of paths of length 3. What about F^3?
Powers of an adjacency matrix gives us information about paths of certain lengths in the associated vertex-edge graph. This connection between graphs and matrices is very useful for solving a variety of problems. For example, it is difficult to accurately and systematically rank players or teams in a tournament. A vertex-edge graph gives you a good picture of the status of the tournament. The corresponding adjacency matrix can help determine the ranking of the players or teams. Consider the following situation.
The second round of a city tennis tournament involved six girls, each of whom was to play every other girl. However, the tournament was rained out after each girl had played only four matches. The results of the play were the following:
Here is the digraph representing the tournament. To read this correctly, an arrow from Anne to Julia means that Anne beat Julia.

First, represent the results of the tournament with a matrix of 0s and 1s. A "1" shows that the player represented by the row beat the player represented by the column.
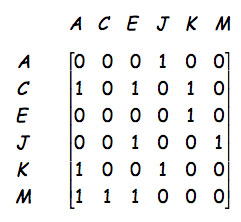
To obtain further information about the performance of the players, sum each row of the adjacency matrix.
To help resolve some of the unclear rankings, compute the square of the adjacency matrix.